MIS Dashboard for Indian Small Businesses: 2026 Guide
Build an MIS dashboard with Google Sheets, Looker Studio, or Power BI. Track sales, cash, GST, receivables, and 4 automations for Indian SMBs daily.
- Indian SMBs put only 3-7% of revenue into digital tooling, and most run on Google Sheets plus WhatsApp (Ken Research, 2025) — which is a workable MIS starting point, not a reason to buy ₹1 lakh software.
- A useful SMB MIS carries 6-12 metrics, not 40, split across sales, cash, and three to five operational numbers specific to the business type.
- A Sheets-based dashboard can be built in about 2 hours and a full setup made operational in 2-4 weeks; SMBs moving to cloud tools report 20-25% productivity gains (NASSCOM, 2024).
- Automating collection is where the time is actually saved — pipe Google Ads and Meta Ads spend and lead data into the sheet with Supermetrics or n8n instead of re-keying it weekly.
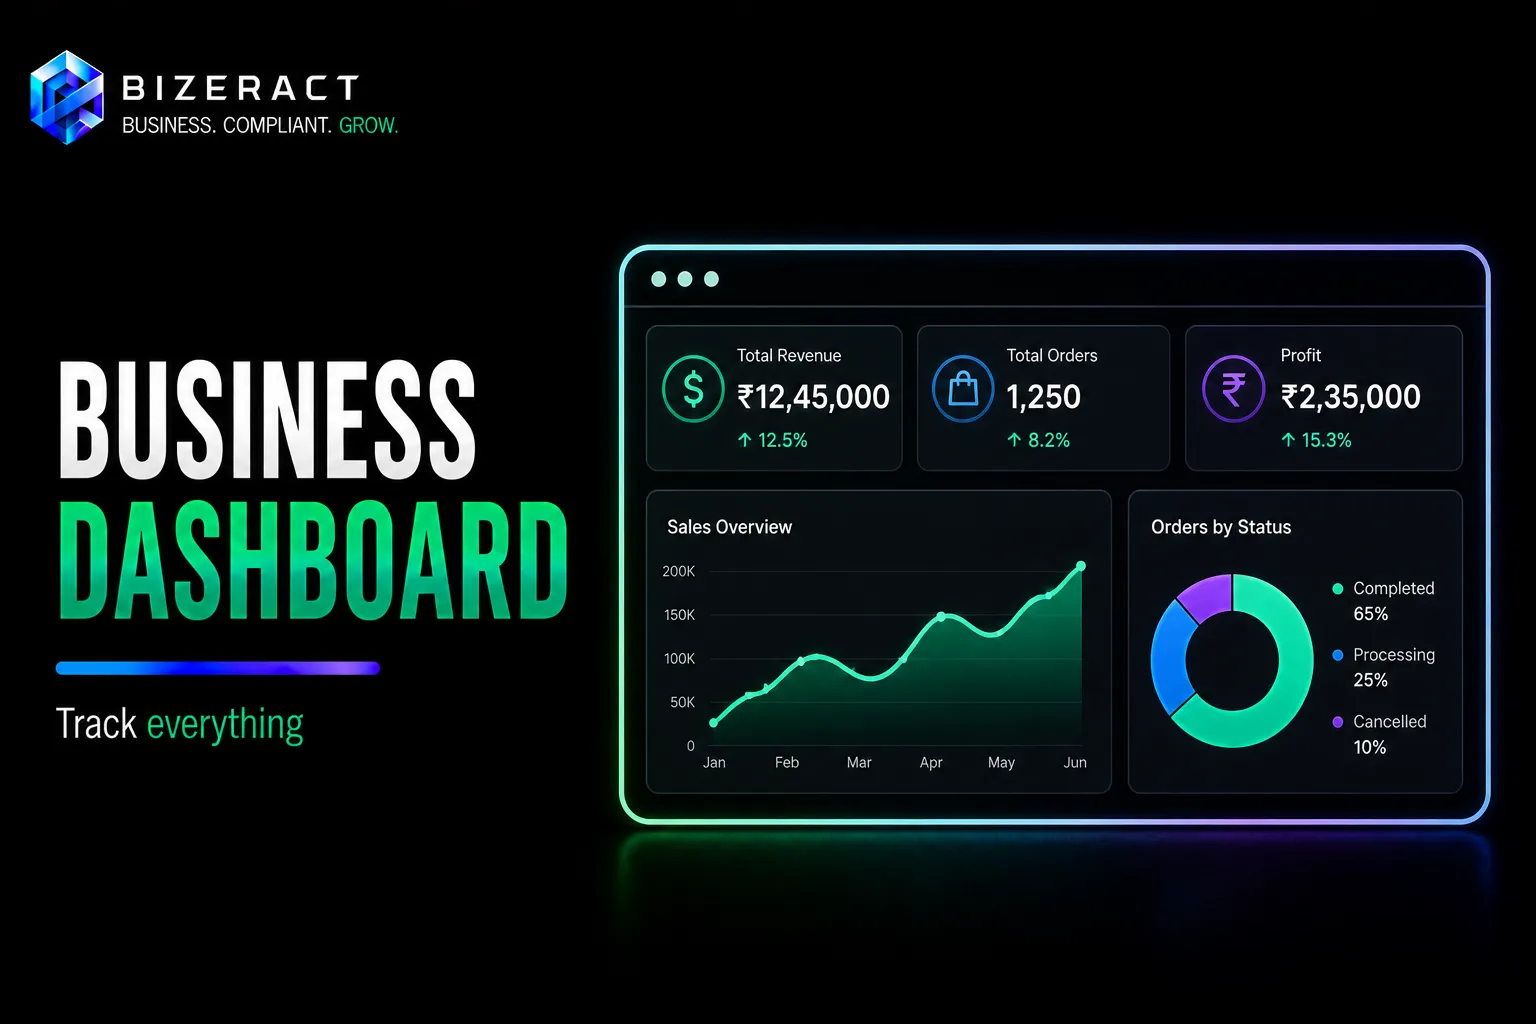
Indian SMBs allocate only 3–7% of revenue to digital solutions, and most still use Google Sheets plus WhatsApp as their "analytics stack" (Ken Research, 2025). An MIS dashboard — Management Information System dashboard — is simply a single screen that shows the numbers that matter to your business, updated automatically. You don't need ₹1 lakh software to build one. Here's how.
Source check: verify dashboard connector capabilities in Google's Looker Studio Google Sheets connector guide, Microsoft's Power BI data sources documentation, and the Looker Studio connector list before choosing a stack.
What belongs in an MIS dashboard
The wrong approach: put everything. The right approach: put only the metrics that change your decisions. A useful SMB MIS dashboard has 6–12 metrics, not 40.
Core metrics by business type:
- Retail / trading: Daily sales vs target, top 10 SKUs by revenue, stock below reorder level, accounts receivable aging, monthly gross margin
- Service business / agency: Revenue vs target, billable hours utilisation, leads this week vs last week, conversion rate, average project value, outstanding invoices
- E-commerce / D2C: Orders, GMV, average order value, return rate, CAC, ROAS by channel, top-selling products
- Manufacturing / production: Output vs plan, rejection rate, raw material inventory, cost per unit, on-time delivery %
Build a free MIS dashboard in Google Sheets in 2 hours
If you're starting from zero and don't want to spend money yet, Google Sheets + Looker Studio is a fully functional, free MIS stack.
- Create a data entry sheet: One tab per data source — Sales, Expenses, Leads, etc. Each row is a record with a date column. Keep it simple; you'll automate data entry later.
- Create a summary tab: Use SUMIF, COUNTIF, and AVERAGEIF formulas to aggregate data by week/month. Add conditional formatting — green if above target, red if below.
- Connect to Looker Studio: In Looker Studio, add Google Sheets as a data source. Build scorecards, bar charts, and trend lines from your summary data. Share the Looker Studio link with your team — it's a live dashboard that updates when you update the Sheet.
SMBs using cloud tools see 20–25% productivity gains (NASSCOM, 2024). The gain isn't from fancy software — it's from having the numbers visible instead of buried in files.
When to move beyond Google Sheets
Sheets works until one of these breaks it:
- More than 3–4 people entering data simultaneously (version conflicts)
- More than 50,000 rows of transaction data (slow performance)
- Data from sources that can't be manually exported — Tally, ERP, POS systems
- You need the dashboard to update automatically without anyone touching a file
At that point, the stack upgrades to: Tally/ERP → Power BI (via connector) → shared dashboard. Or: CRM/ads/e-commerce → Zapier/Make → Google Sheets/BigQuery → Looker Studio. Either path can be operational in 2–4 weeks for a typical Indian SMB.
Automating data collection: the real time-saver
Manual data entry into a dashboard is an MIS dashboard in theory, not in practice. The moment someone doesn't update it for three days, it becomes useless.
The highest-value automations for Indian SMBs:
- WhatsApp sales reports to Sheets: Use a WhatsApp bot (Interakt or similar) to collect daily sales data from field sales teams. Bot asks "today's sales?" each evening and records the response in Sheets.
- Tally to Power BI: Tally connector syncs P&L, balance sheet, and transaction data to Power BI automatically. No manual export needed.
- Google Ads + Meta Ads → Sheets via Supermetrics or n8n: Daily ad spend and lead data piped automatically into a marketing spend tab.
- CRM to Sheets: Zoho CRM, HubSpot Free, or Freshsales all have Sheets integrations or Zapier connectors that sync new leads and deal stages automatically.
The MIS dashboard template for Indian SMBs
A useful starting template has four sections:
- Revenue section: This month vs last month vs target. One chart.
- Operations section: The 3–5 operational metrics most relevant to your business type (see the list at the top of this article).
- Marketing section: Leads this week, conversion rate, cost per lead by channel.
- Cash section: Cash in bank, outstanding receivables, upcoming payables. This is the one founders actually need before anything else.
We build MIS dashboards for Indian SMBs — from a simple Google Sheets + Looker Studio setup to a full Power BI implementation connected to Tally. See our dashboard services or talk to us about what your business actually needs before deciding on a tool.
What to verify before acting on MIS Dashboard for Indian Small Businesses
Rules and platform behaviour change after an article is published. Confirm event definitions, conversion settings, consent mode, attribution reports, and data retention against the Google Analytics Help before you act on anything below, because the right answer depends on your entity, state, turnover, and current setup.
| Checkpoint | Why it matters | Where to confirm |
|---|---|---|
| Current rule or platform status | Limits, forms, policies, and APIs can change after a blog update. | Google Analytics Help |
| Your exact business case | A local shop, freelancer, D2C store, agency, and SaaS team rarely need the same next step. | Documents, invoices, campaign data, analytics setup, or workflow logs |
| Implementation evidence | The safest tracking decision is backed by proof, not memory or screenshots from an old setup. | Portal acknowledgement, dashboard export, invoice sample, test lead, or error log |
Going deeper: MIS Dashboards, Executive Dashboards, and Reporting Automation.
Frequently asked questions
What is the short answer on MIS Dashboard for Indian Small Businesses?
Build an MIS dashboard with Google Sheets, Looker Studio, or Power BI. Track sales, cash, GST, receivables, and 4 automations for Indian SMBs daily. The practical next step is to compare the article checklist with your business model, state, turnover, documents, and tools before you act.
What should I verify before using this guide?
Verify the latest event definitions, attribution windows, dashboard formulas, and Google documentation from the official source links on this page. Tax rules, ad platform policies, software APIs, marketplace requirements, and search documentation can change after publication.
When should I get professional help?
Get help when the decision affects GST registration, tax filing, paid media budget, production website performance, analytics accuracy, or business-critical automations. A short expert review usually costs less than penalties, rework, bad data, or failed implementation.
Let's talk about your business.
Tell us what you're working on and where you want to go. We'll put together a plan. No obligation, no sales pitch.
- Free 30-minute call
- A plan built around your goals
- No obligation, no pressure
- Your own account manager